Website Performance Monitoring: Metrics, Tools & How-To (2026)
Website performance monitoring catches speed regressions before they cost you conversions and rankings. The metrics that matter (Core Web Vitals), tools, and how to monitor continuously.
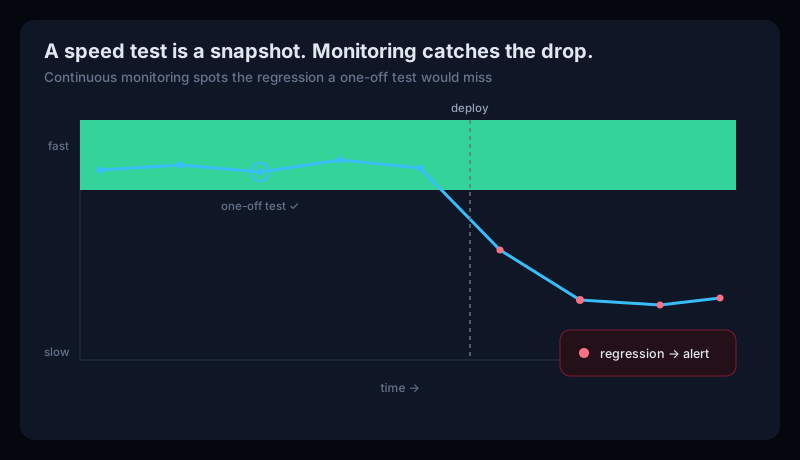
A fast site converts better and ranks better — and a slow one quietly costs you both. Website performance monitoring is how you keep speed from slipping: instead of running a one-off test and hoping, you track your performance continuously and get alerted the moment it regresses. This guide covers what website performance monitoring is, the metrics that matter, and what to look for in a website performance monitoring tool.
What is website performance monitoring?
Website performance monitoring is the continuous tracking of how fast your pages load and respond, on a schedule, with alerts when the numbers get worse. It's a close cousin of uptime monitoring— but where uptime asks “is the site up?”, performance monitoring asks “is it fast?” A site can be perfectly up and still be slow enough to lose customers and rankings.
Why performance matters
- Conversions. Every extra second of load time costs conversions — slow pages get abandoned before they finish rendering.
- SEO & rankings.Core Web Vitals are part of Google's page experience signals, so poor performance can hold a page back, especially on mobile.
- It drifts.Performance isn't set once — a new hero image, a marketing tag, a plugin, or a framework upgrade can quietly slow a page months after launch. Without monitoring, you find out from a traffic dip, not an alert.
The metrics that matter: Core Web Vitals
Google's three Core Web Vitals are the heart of modern performance monitoring. Here are the “good” and “poor” thresholds:
| Metric | Measures | Good | Poor |
|---|---|---|---|
| LCP | Loading | ≤ 2.5s | > 4.0s |
| INP | Interactivity | ≤ 200ms | > 500ms |
| CLS | Visual stability | ≤ 0.1 | > 0.25 |
LCP (Largest Contentful Paint) is how long the main content takes to load; INP (Interaction to Next Paint, which replaced FID) is how quickly the page responds to input; and CLS (Cumulative Layout Shift) is how much the layout jumps around. Beyond these, a good tool also tracks overall page load time and page weight. Run a one-off check now with our free Core Web Vitals test.
Lab data vs field data
There are two ways to measure performance, and a good monitoring setup understands both:
- Lab data — a controlled test from a single environment (Lighthouse, PageSpeed Insights). Reproducible, ideal for catching regressions between releases.
- Field data — what real visitors actually experience across their devices and networks. This is what Google ultimately ranks on.
One-off test vs continuous monitoring
Free tools like PageSpeed Insights give you an excellent snapshot — but a snapshot is all it is. The regressions that hurt you are introduced by changes: the deploy that ships an unoptimised image, the new analytics tag, the A/B-test script.
Monitoring catches what a one-off test can't
What to look for in a website performance monitoring tool
- Core Web Vitals over time — tracked on a schedule, with history, not just a one-off score.
- Regression alerts — email or Slack the moment a score crosses a threshold, so you catch the bad deploy fast.
- Real measurement— ideally backed by Google's own PageSpeed Insights, so your numbers match what Google sees.
- Paired with the rest of site health — performance is one signal; uptime, SSL, DNS, and SEO are the others.
Website Performance Monitoring FAQ
What is website performance monitoring?
Website performance monitoring is the continuous, automated tracking of how fast your pages load and respond — especially Google's Core Web Vitals — so you're alerted when performance regresses. Unlike a one-off speed test, which is a single snapshot, monitoring watches your scores over time and tells you the moment a deploy or a new asset slows things down.
What metrics should a performance monitoring tool track?
The three Core Web Vitals are the priority: Largest Contentful Paint (LCP) for loading, Interaction to Next Paint (INP) for responsiveness, and Cumulative Layout Shift (CLS) for visual stability. Good targets are LCP ≤ 2.5s, INP ≤ 200ms, and CLS ≤ 0.1. A good tool also tracks overall page load time and total page weight.
Isn't a one-off speed test enough?
A speed test like PageSpeed Insights is great for a point-in-time check, but it won't tell you when a future deploy adds a heavy script, an unoptimised image, or a third-party tag that tanks your scores. Performance drifts, and regressions are usually introduced by changes — which is exactly what continuous monitoring catches and a one-off test can't.
Does website performance affect SEO?
Yes. Core Web Vitals are part of Google's page experience signals, so poor LCP, INP, or CLS can hold a page back — especially on mobile. Google ranks on field data (what real users experience), so monitoring your real-world performance over time protects both conversions and rankings.
Monitor your performance free
Uptura's performance monitoringtracks your Core Web Vitals continuously — measured with Google PageSpeed Insights, so your scores line up with Google's own — and alerts you by email and Slack the moment a deploy drags them down. And because “fast” is only part of a healthy site, it watches uptime, SSL, DNS, SEO, and accessibility from the same dashboard. It's free during our public beta, no credit card required. You can also run a one-off check with our free Core Web Vitals test. Create a free account to start monitoring.